
QDrive
Tachograph, diagnostic, location and energy data read by AI — improving safety, efficiency, charging and carbon performance.
Turning what the vehicles record into better operation
Driving and diagnostic data show risky driving — and how you are doing on cost and carbon.
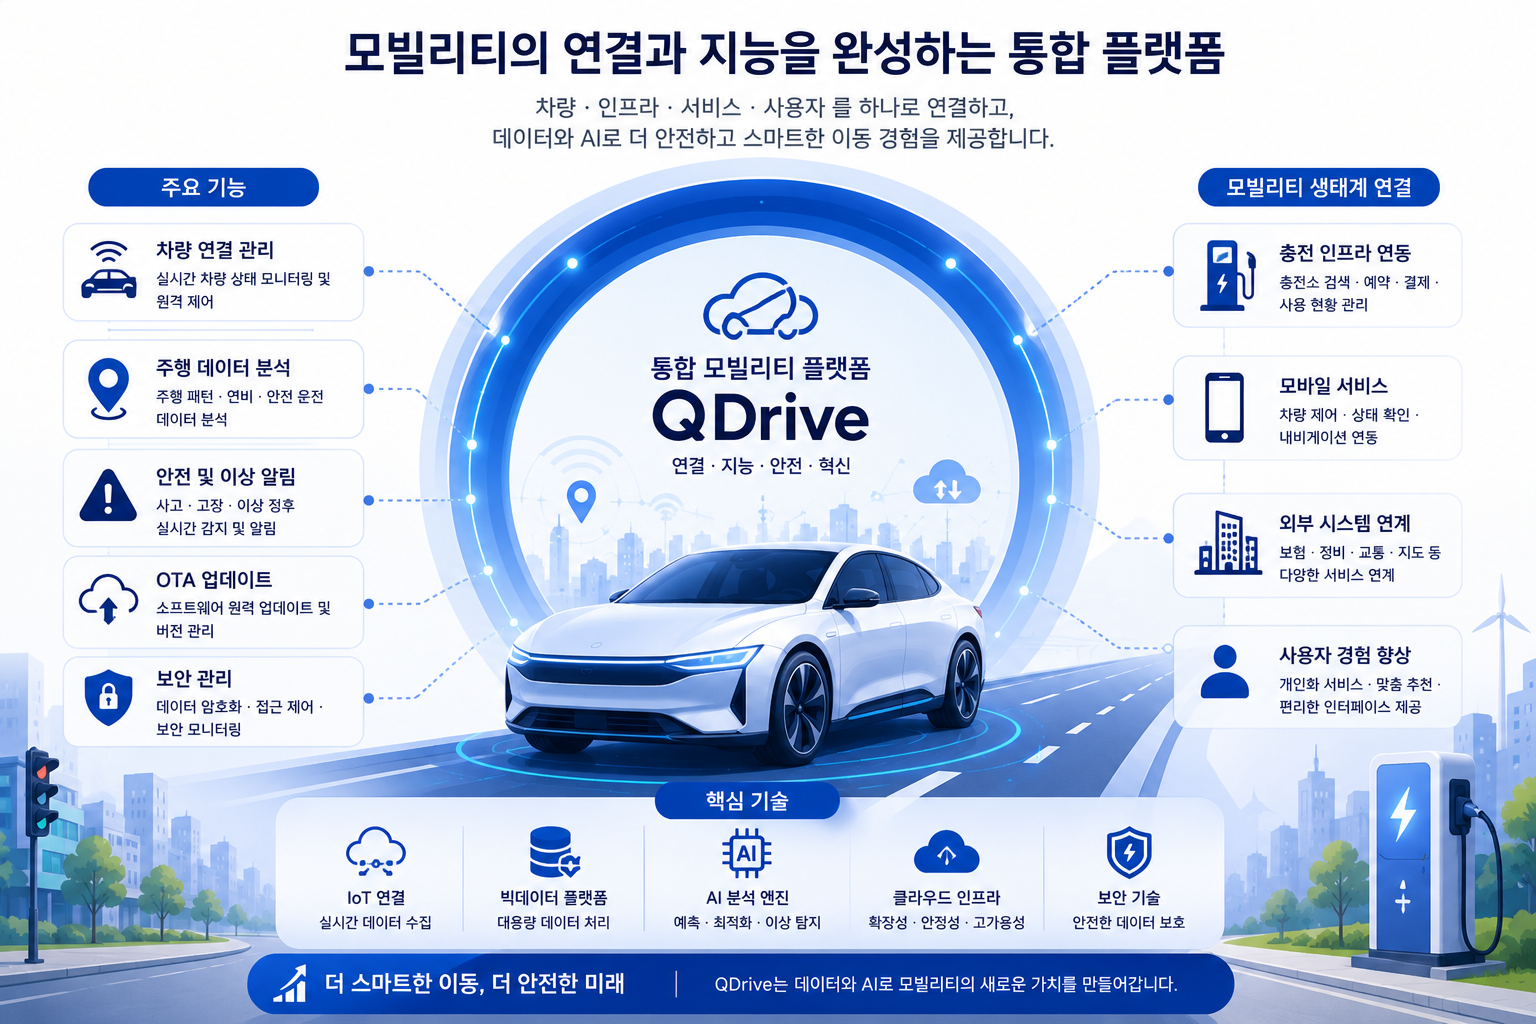
AI that suggests what to do next
Operators, fleet managers and drivers work from the same data to cut risk and waste.
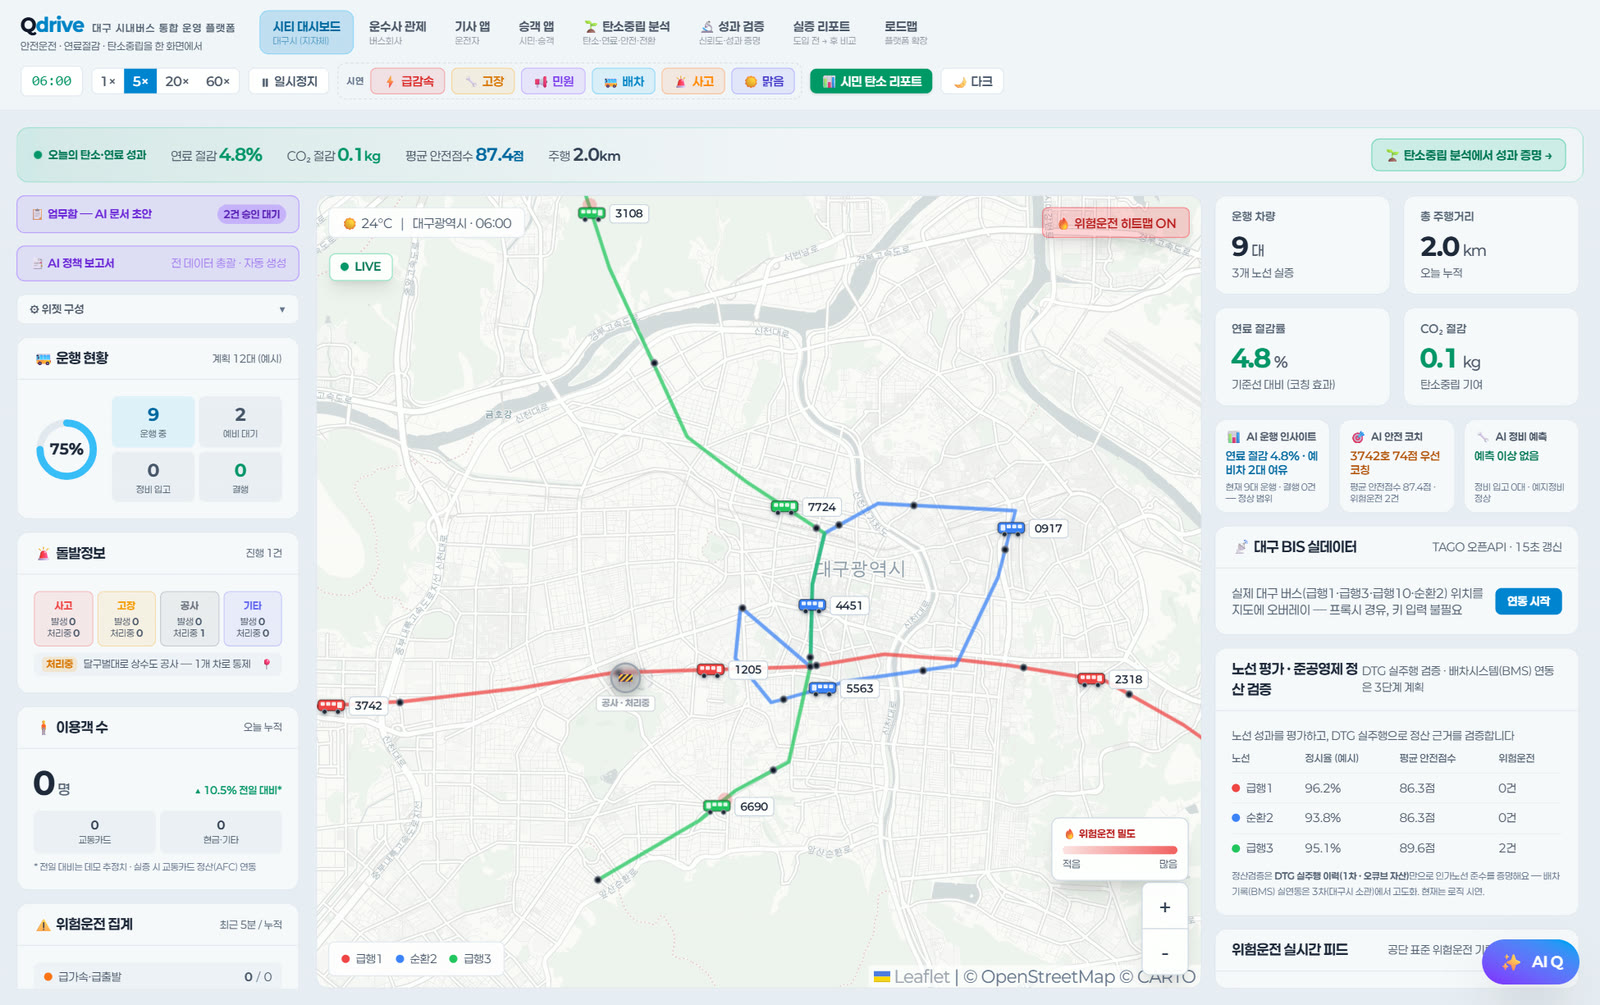
Fleet-wide monitoring
Positions, running state, accidents, faults and risky-driving events in one view — so you see how the fleet is moving and what needs attention first.
- Live overview Position, utilisation, availability and incidents, on a map and in figures
- Risky stretches Where harsh acceleration, braking and cornering keep happening — with the weather and road conditions alongside
- Comparing performance Safety, fuel and efficiency compared on the same basis, by vehicle, driver and route
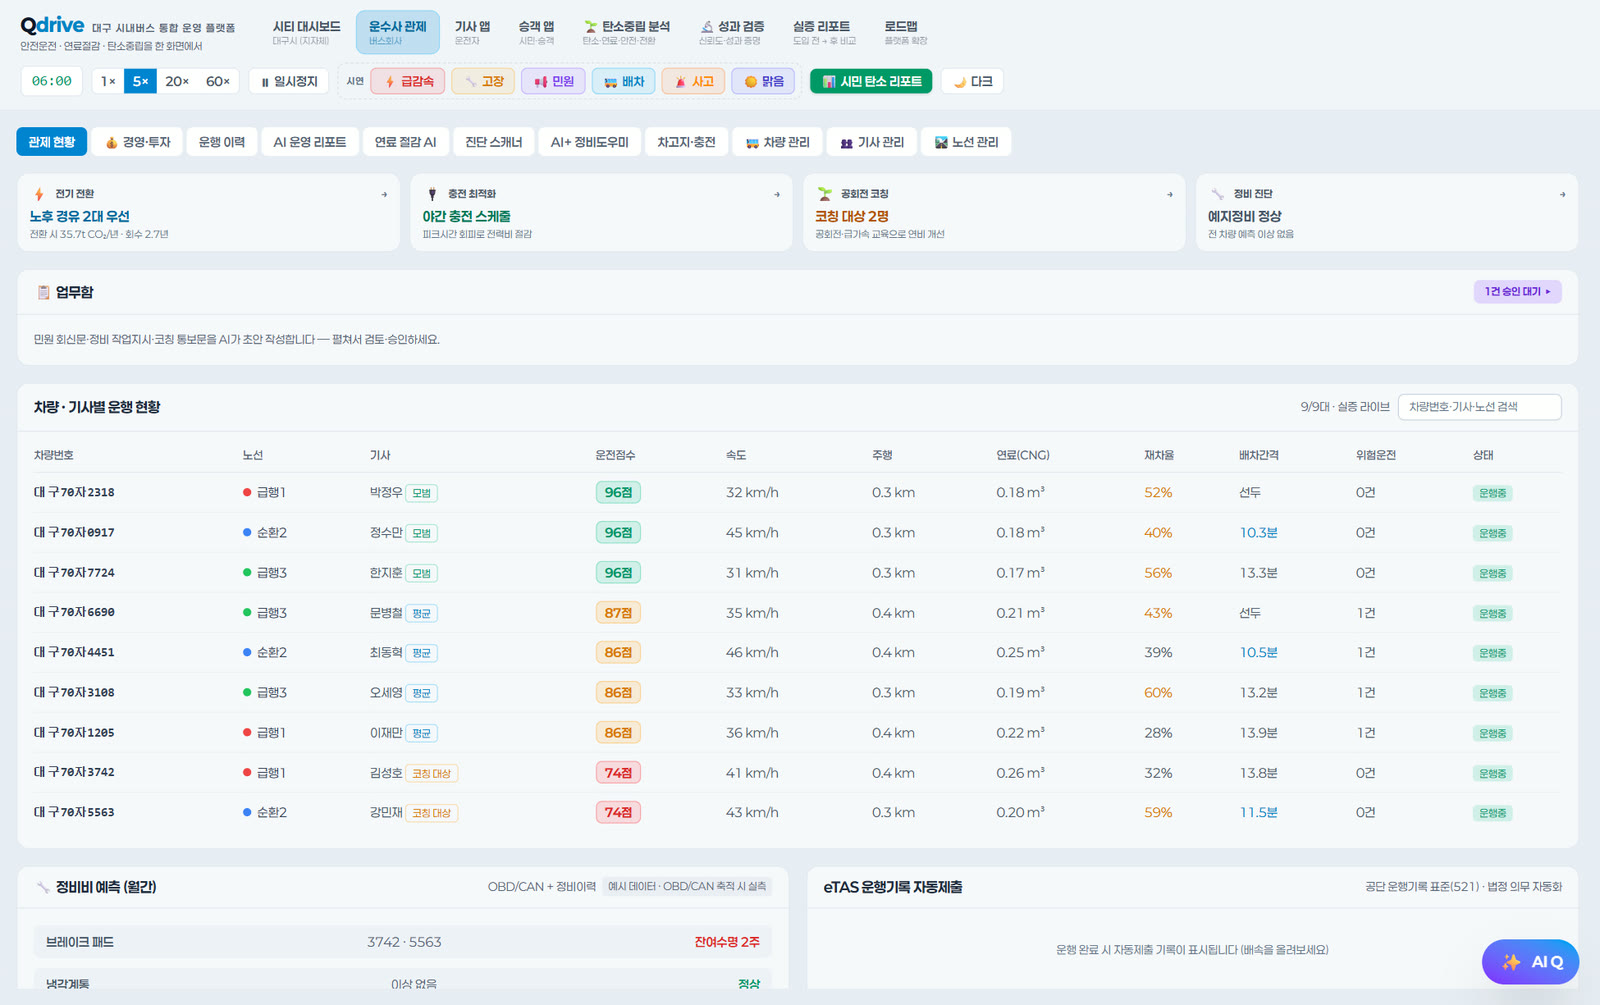
Vehicle and driver level
Each vehicle and driver accounted for, with maintenance, dispatch and deployment adjusted around fault signs and demand.
- Vehicle and driver status Driving score, fuel, utilisation, distance and event history, per unit
- Preventive maintenance Diagnostic and CAN signals show what may fail and when to service it
- Planning and records Deployment adjusted to demand, with trip records and what was done kept together
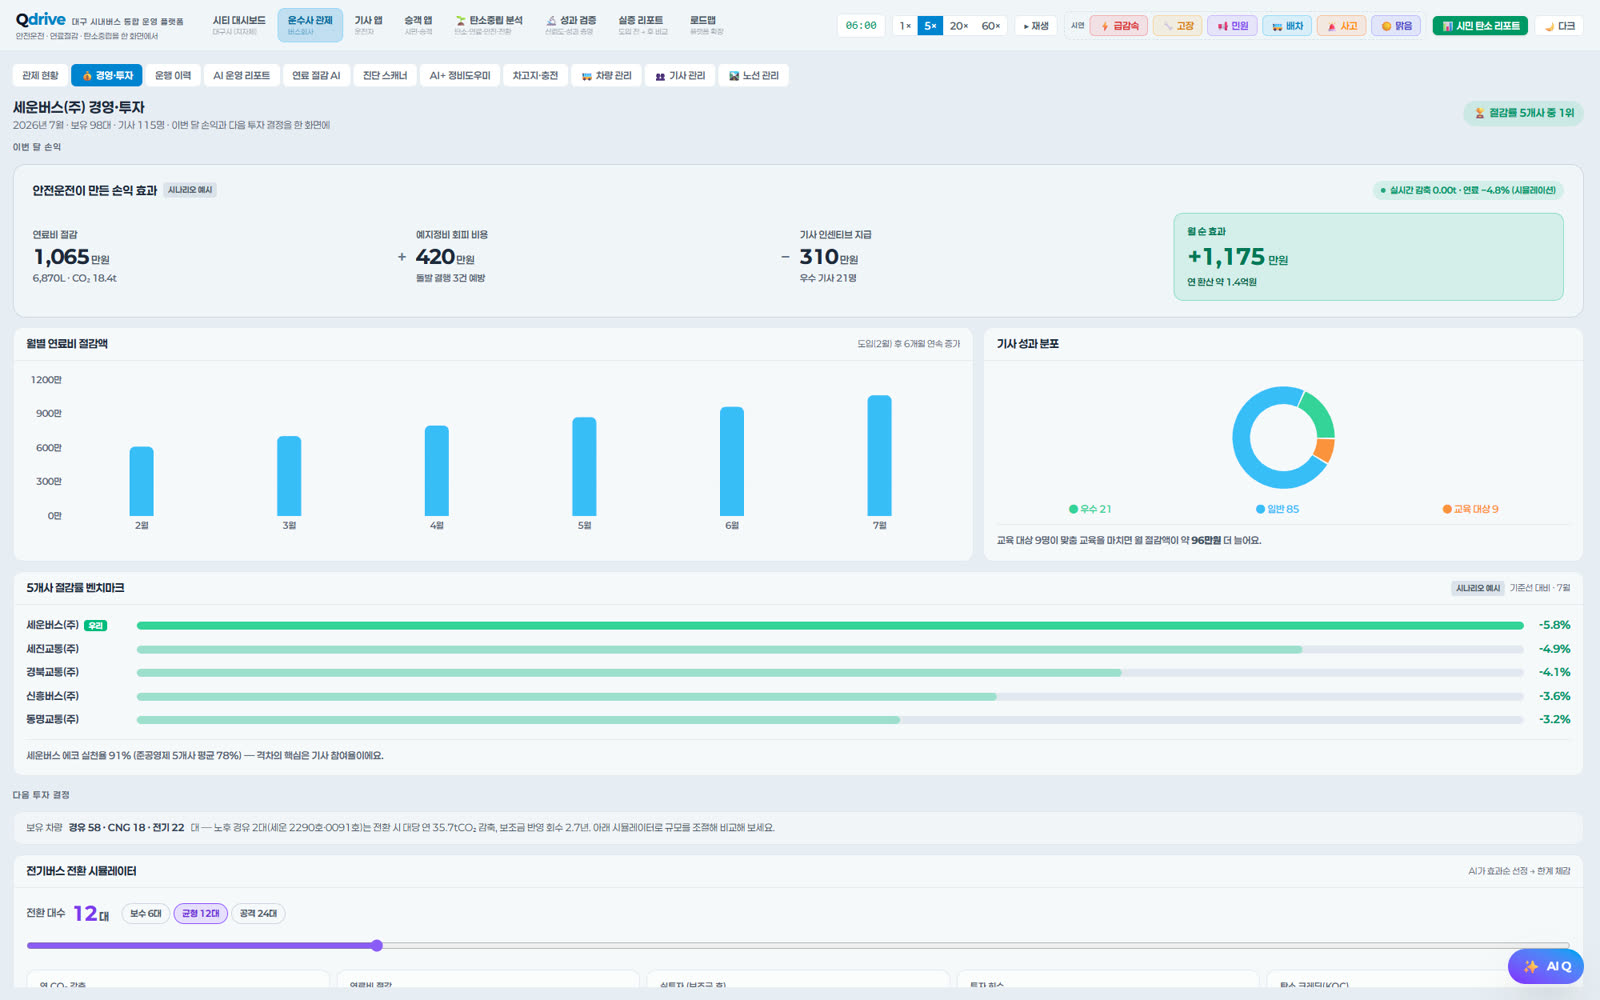
Results and the case for investing
Fuel savings, avoided maintenance and driver incentives add up to a monthly figure — and to the numbers the next investment decision needs.
- The monthly picture Fuel savings, avoided maintenance and incentives, netted off for the month
- Savings over time How savings have moved since it went in, period by period
- Distribution and benchmark Performance by driver and vehicle group, set against comparable operations
Coaching for each driver
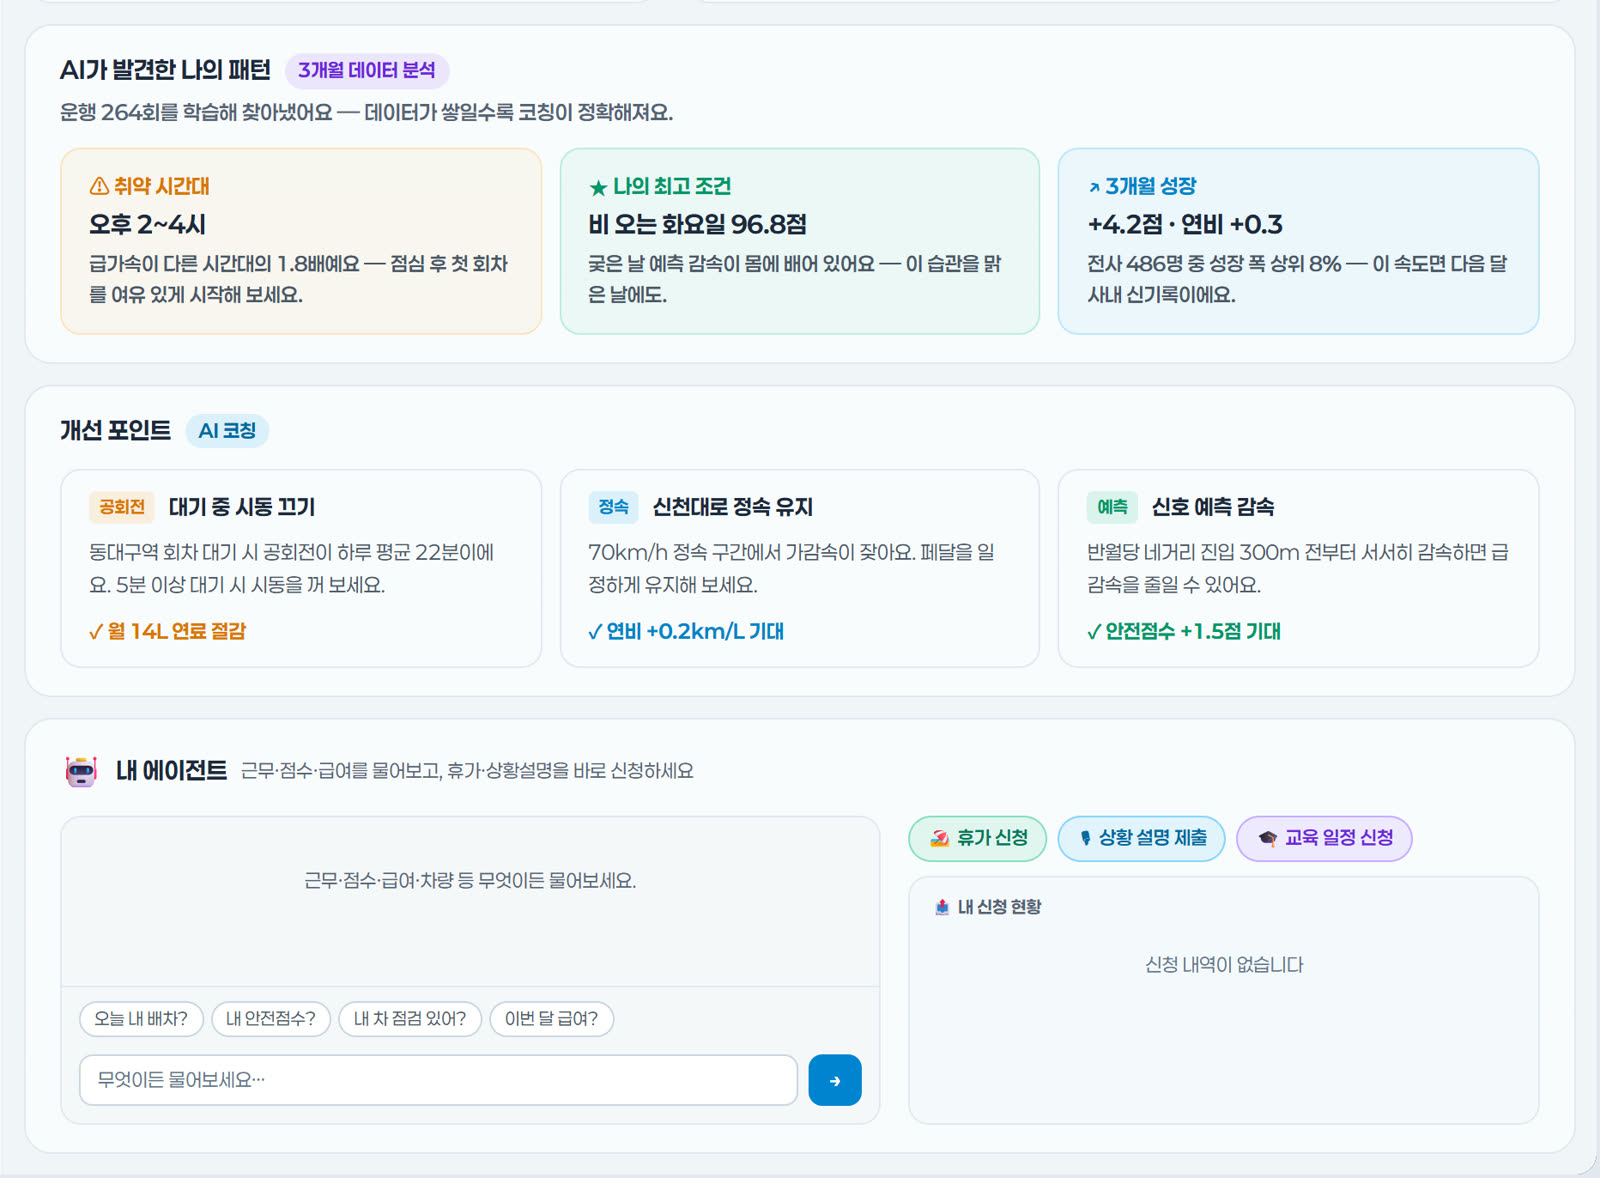
Driving behaviour explained in the light of road, weather and operating conditions — with what to change for safety and efficiency.
- Judged in context Congestion, weather and conditions taken into account, giving something fairer than a bare score
- Coaching you can act on Idling, holding a steady speed, easing off before the lights — things a driver can do today
- Did it work Safety score, fuel and energy use compared before and after the coaching
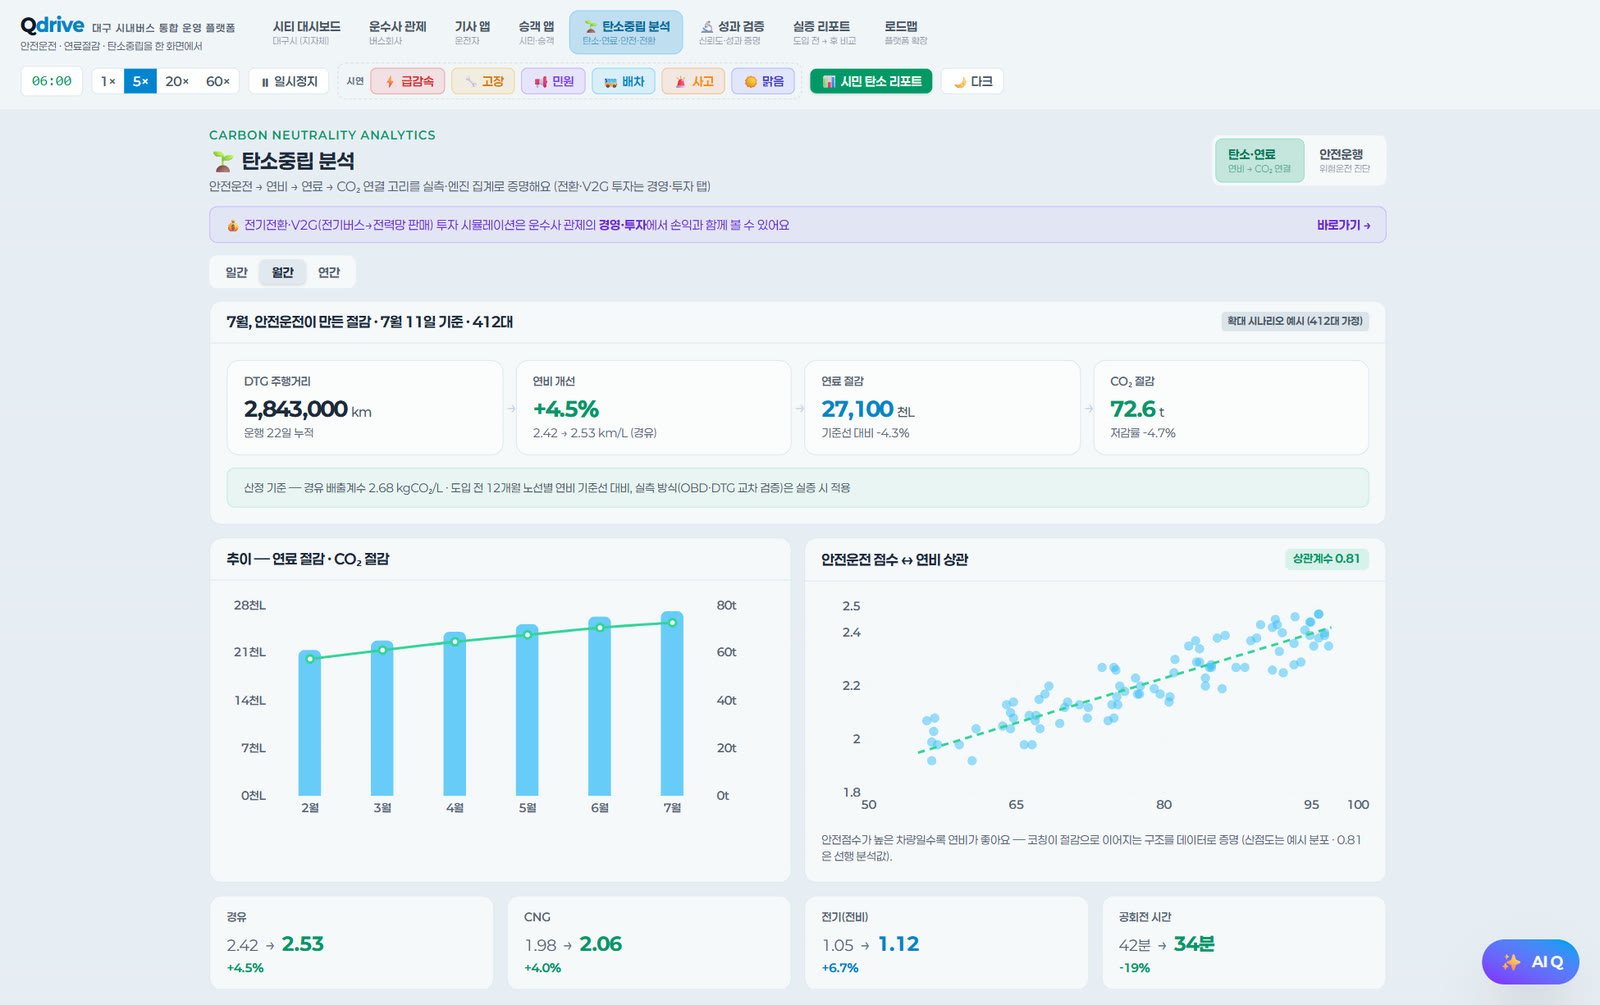
Carbon and energy savings
Emissions savings are worked out from recorded distance and fuel economy — and how driving habits affect that economy is looked at too.
- Based on distance and economy Savings calculated from the tachograph’s distance and fuel economy
- Safe driving and fuel economy How habits move fuel economy, expressed as a correlation
- Over time Improvement accumulated period by period
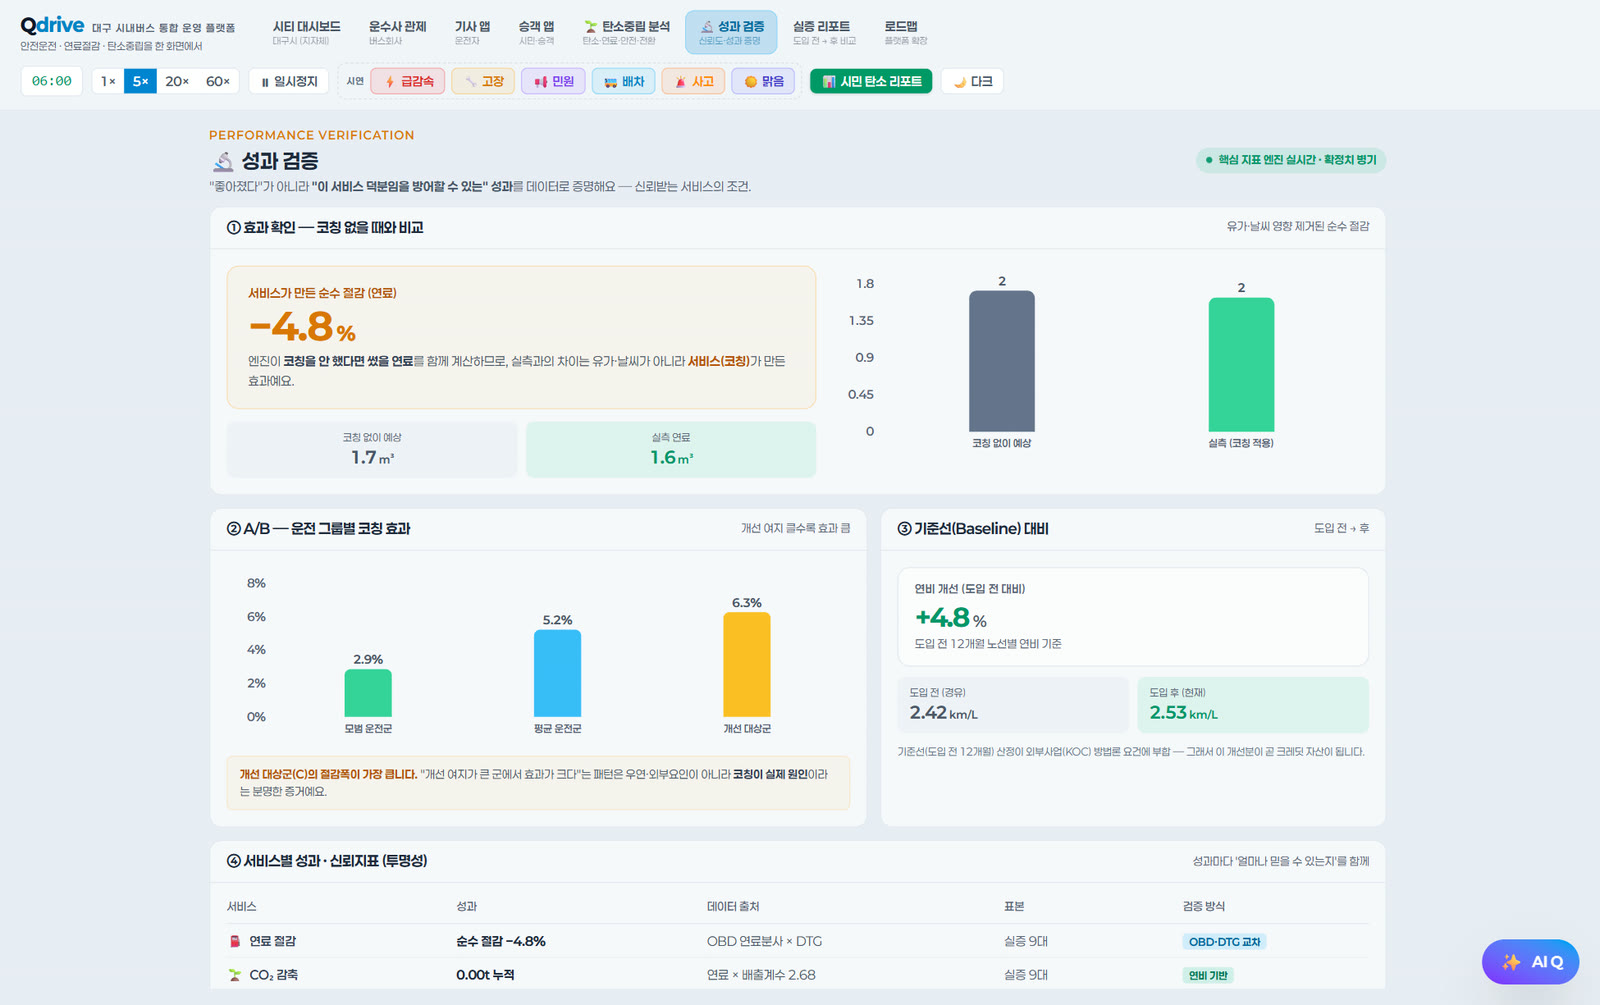
Proving the effect
Compared against what would have happened without AI, and across driver groups before and after coaching — so the improvement has evidence behind it.
- Against doing nothing The same conditions, without AI, as the point of comparison
- Group by group Drivers split into groups and compared before and after coaching
- Cross-checked On-board diagnostics checked against the tachograph, so the numbers hold
Everything the vehicle and the operation produce, on one standard
Driving, diagnostic, location, communication and charging data joined by standard, ready to analyse and act on.
| Data | What is collected | Device | Standard / interface |
|---|---|---|---|
| Trip records | Speed, RPM, distance, harsh acceleration and braking, driving habits | Digital tachograph (DTG) | Tachograph standard · serial, USB |
| Vehicle diagnostics | Engine, fuel, battery, fault codes, consumable condition | On-board diagnostics (OBD) | OBD-II PID · CAN·CAN-FD |
| Position and movement | Live coordinates, speed, route and route sections | GPS, GNSS and precise-positioning receivers | NMEA 0183 · RTK·RTCM |
| Data transmission | Vehicle, sensor and operational data sent live | In-vehicle gateway and communication module | LTE Cat M1 · MQTT·HTTPS |
| Energy and charging | Battery condition, power use, charging sessions, charge and discharge plans | BMS, chargers, charging infrastructure | OCPP · ISO 15118 |
| Emissions | Emissions and reductions from distance, fuel and electricity use | Driving, diagnostic and energy data combined | GHG Protocol · ISO 14064 |
What QDrive gives you
One view of the fleet
Location, driving and diagnostics,
shared by drivers and operations
Safer driving, better maintenance
Risky driving and faults caught early,
feeding coaching and maintenance
Energy and charging tuned
Battery and power use per vehicle,
tuning charging and deployment
Carbon performance
Emissions from distance and fuel,
with each reduction verified
It suits operations like these
For organisations managing driving, safety, energy and carbon together.
Public transport, shuttles and MaaS
Where many vehicles must be tracked, and safety and service quality managed alongside
Logistics, delivery and field service
Fleets that must cover more ground while spending less on fuel, accidents and repairs
Rental, car sharing and company fleets
Where vehicle condition and usage history need standardising, and safety, maintenance and reporting need structure
EV fleets and charging infrastructure
Where battery and charge state must feed the schedule, and energy cost and carbon reduction have to be managed